dev-resources.site
for different kinds of informations.
JavaScript Magic Tricks: Debugger Interception
JavaScript Magic Tricks: Debugger Interception
The debugger instruction is typically used for debugging in execution environments such as web browsers, and it can cause a break in JavaScript code. If you want to intercept the debugger statement, it is not easy to do so using common function replacements or using Proxy objects, for example:
window.debugger = (function() {
    var origDebug = console.debugger;
    return function() {
    // do something before debugger statement execution

    origDebug.apply(console, arguments);
    // do something after debugger statement execution
    };
})();
Or:
var handler = {
  get: function(target, prop, receiver) {
    if (prop === 'debugger') {
      throw new Error("Debugger statement not allowed!");
    }
    return Reflect.get(target, prop, receiver);
  }
};
var obj = new Proxy({}, handler);
Both of the above methods are ineffective in intercepting the debugger statement. Even the renowned artificial intelligence ChatGPT believes that the debugger cannot be intercepted, as shown in the screenshot below:
There are multiple ways to write a debugger statement in JavaScript, such as:
1、debugger;
2、Function("debugger").call();
3、eval("debugger");
4、setInterval(function(){debugger;},1000);
5、[].constructor.constructor('debugger')();
The most primitive debugger, trying to intercept a specific word seems infeasible, but its usage frequency in reality is not high, and the later types of usage are more common. This is because debuggers are often used for anti-debugging purposes, such as when JShaman is used to obfuscate and encrypt JavaScript code, multiple different debugger directives can be added for anti-debugging purposes.
The last four usages shown above can be intercepted in the code.
Function("debugger").call()
Example of interception:
Function_backup = Function;
Function = function(a){
    if (a =='debugger'){
        console.log("拦截了debugger,中断不会发生1")
        return Function_backup("console.log()")
    }else{
        return Function_backup(a)
    }
}
Function("debugger").call();
Execute result:
eval("debugger")
Example of interception:
eval_backup = eval;
eval = function(a){
if(a=='debugger'){
console.log("拦截了debugger,中断不会发生0")

        return ''
    }else{
        return eval_backup(a)
    }
}
eval("debugger");
Execute result:
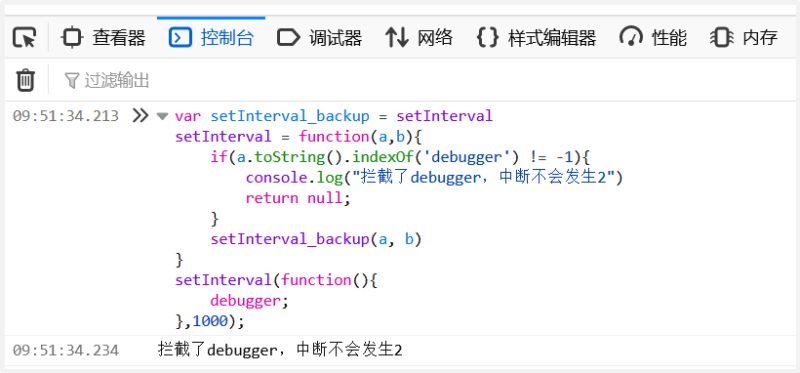
setInterval(function(){debugger;},1000)
Example of interception:
var setInterval_backup = setInterval
setInterval = function(a,b){
    if(a.toString().indexOf('debugger') != -1){
        console.log("拦截了debugger,中断不会发生2")
        return null;
    }
    setInterval_backup(a, b)
}
setInterval(function(){
    debugger;
},1000);
Execute result:
[].constructor.constructor('debugger')()
Example of interception:
var constructor_backup = [].constructor.constructor;
[].constructor.constructor = function(a){
    if(a=="debugger"){
        console.log("拦截了debugger,中断不会发生3");
    }else{
        constructor_backup(a);
    }
}

try {
    [].constructor.constructor('debugger')();
} catch (error) {
    console.error("Anti debugger");
}
Execute result:
Featured ones:


