dev-resources.site
for different kinds of informations.
Automate 3scale monitoring stack deployment
I wanted to automate the deployment the a monitoring stack for 3scale which is documented here as there were a lot of manual steps.
First I clone the 3scale-operator repo as I need access to files there. I already have 3scale-operator setup in the 3scale-test project so I change to that project.
#!/bin/bash
git clone [email protected]:3scale/3scale-operator.git
cd 3scale-operator/doc/monitoring-stack-deployment
oc project 3scale-test
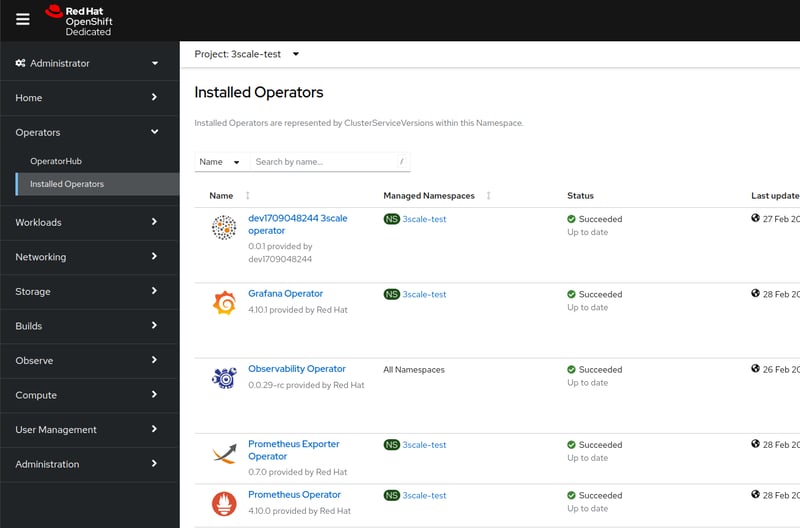
There were a couple of steps that involved using the Openshift UI to install operators. I needed a way to deploy the Prometheus and Grafana operators from the command line. As this was an Openshift 4 Kubernetes cluster it had OLM(operator lifecycle manager) installed. So it was just a matter of creating subscriptions which is the resource that OLM is watching for to deploy operators. And I got the prometheus and grafana operators installed
# Create a subscription for prometheus operator
oc apply -f - <<EOF
---
apiVersion: operators.coreos.com/v1alpha1
kind: Subscription
metadata:
  name: rhods-prometheus-operator
  namespace: 3scale-test
spec:
  channel: beta
  installPlanApproval: Automatic
  name: rhods-prometheus-operator
  source: redhat-operators
  sourceNamespace: openshift-marketplace
  startingCSV: rhods-prometheus-operator.4.10.0
EOF
# Create Grafana Subscription
oc apply -f - <<EOF
---
apiVersion: operators.coreos.com/v1alpha1
kind: Subscription
metadata:
  name: grafana-operator
  namespace: 3scale-test
spec:
  channel: v4
  installPlanApproval: Automatic
  name: grafana-operator
  source: community-operators
  sourceNamespace: openshift-marketplace
  startingCSV: grafana-operator.v4.10.1
EOF
# added a sleep to let the installs finish
sleep 60
You can see them installed in the Openshift UI
You have to enable monitoring in the APIManger custom resource the following command does this.
# patch apimanager called apimanger-sample CR monitoring enabled true
oc patch apimanager apimanager-sample --type='json' -p='[{"op": "add", "path": "/spec/monitoring", "value": {"enabled": true}}]'
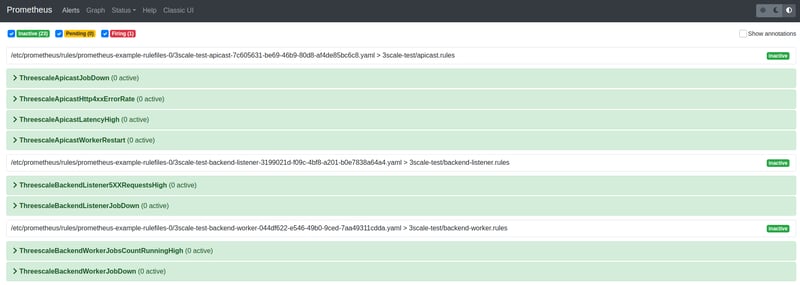
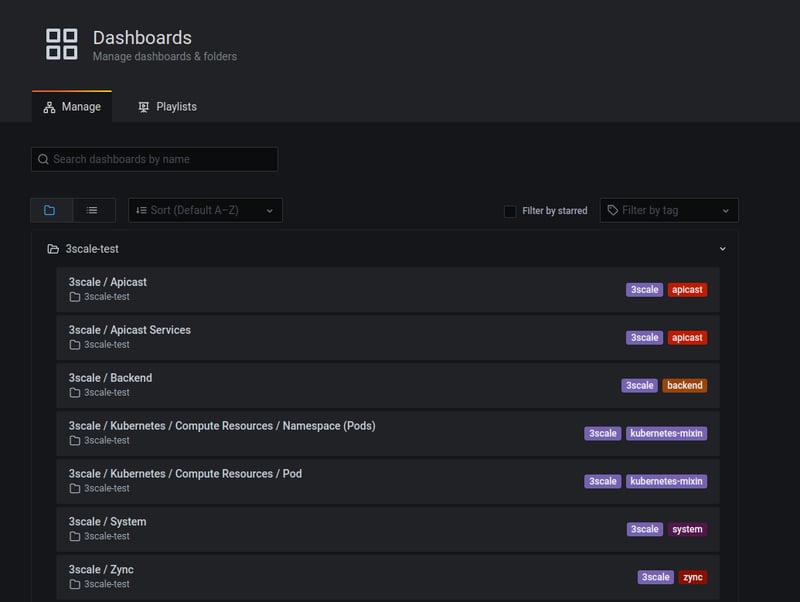
This basically gets the 3scale-operator to deploy grafana and promentheus resources for monitoring 3scale i.e. grafana dashboards, prometheus alerts.
Next came setting up the scrapeconfig that allows scraping monitoring data from the clusters monitoring stack. This requires getting a token from the Openshift monitoring stack and patching that token into the scrapconfig file and create a secret from that file. Steps outline below
# Get the SECRET name that contains the THANOS_QUERIER_BEARER_TOKEN
SECRET=`oc get secret -n openshift-user-workload-monitoring | grep  prometheus-user-workload-token | head -n 1 | awk '{print $1 }'`
# Get the THANOS_QUERIER_BEARER_TOKEN using the SECRET name
THANOS_QUERIER_BEARER_TOKEN=$(oc get secret $SECRET -n openshift-user-workload-monitoring -o jsonpath="{.data.token}" | base64 -d)
# patch the THANOS_QUERIER_BEARER_TOKEN in the 3scale-scrape-configs.yaml
sed -i "s|<THANOS_QUERIER_BEARER_TOKEN>|$THANOS_QUERIER_BEARER_TOKEN|g" 3scale-scrape-configs.yaml
# create secret addition-scrape-configs from 3scale-scrape-configs.yaml file
oc create secret generic additional-scrape-configs --from-file=3scale-scrape-configs.yaml=./3scale-scrape-configs.yaml
NOTE: I have kubeadmin privilages, so I haven't investigated the minimum permissions required to get this secret
Next we need to set the route in the prometheus.yaml file and apply the file to create an instance of Prometheus and expose a route to access from the browser
# Prometheus CR
DOMAIN=$(oc get routes console -n openshift-console -o json | jq -r '.status.ingress[0].routerCanonicalHostname' | sed 's/router-default.//')
EXTERNALURL=https://prometheus.3scale-test.$DOMAIN
sed -i "s|externalUrl:.*|externalUrl: $EXTERNALURL|" prometheus.yaml
oc apply -f prometheus.yaml
sleep 5
oc expose service prometheus-operated --hostname prometheus.3scale-test.$DOMAIN
Then we can apply the grafana CR's(Custom Resources) to create an instance of the Grafana
# Grafana CR's
oc apply -f datasource.yaml
oc apply -f grafana.yaml
At this stage we should have a grafana and prometheus setup with all the 3scale monitoring available
And finally clean up the operator that was cloned
# remove 3scale-operator dir
cd ../../../
rm -rf 3scale-operator
code lives here
NOTE: this file also installs the prometheus-exporter to add a grafana dashboard for the backend redis.
Featured ones:


