dev-resources.site
for different kinds of informations.
Solving the Logistics Puzzle: How Geospatial Data Visualization Optimizes Delivery and Transportation
Ever wonder how some companies seem to manage their deliveries so effortlessly? What's their secret? It's likely they're harnessing the power of geospatial data visualization. In this post, we'll explore how businesses are using this technology to optimize their logistics and deliver incredible results.
1. The Logistics Bottleneck: Three Key Challenges Holding Businesses Back
Efficient logistics are crucial for business success, yet many companies struggle with persistent inefficiencies that impact their bottom line and customer satisfaction. Let's examine three major problem areas:
1.1. Route optimization remains a significant hurdle
Poorly planned delivery routes lead to wasted fuel, increased delivery times, and driver fatigue. Without a systematic approach to route planning, companies often rely on guesswork or outdated methods, resulting in longer delivery times, higher fuel costs, and increased driver stress. This inefficiency translates directly into reduced profitability and a negative impact on the customer experience.
1.2. Lack of real-time visibility creates significant challenges in managing the complexities of modern supply chains
Without effective tracking and monitoring of shipments, it’s difficult to identify and address potential problems proactively. Delays can arise unexpectedly, leading to missed deadlines, dissatisfied customers, and additional costs. Furthermore, the inability to monitor assets precisely increases the risk of loss or damage, resulting in further financial implications.
1.3. Inefficient resource allocation compounds the logistics problem
Uneven workloads among drivers, underutilized vehicles, and poorly located warehouses all contribute to operational inefficiencies. This lack of optimization leads to increased labor costs, higher vehicle maintenance expenses, and ultimately, diminished profitability. Without data-driven insights, companies struggle to effectively distribute resources, leading to significant operational challenges.
II. Bridging the Gap: Data-Driven Decisions for Smarter Logistics
The challenges we've discussed—inefficient routing, lack of real-time visibility, and poor resource allocation—underscore a critical need for a more data-driven approach to logistics management. Traditional methods often rely on guesswork and historical data, leading to costly inefficiencies. This is where geospatial data visualization comes in.
Geospatial data visualization is the practice of using maps and other visual tools to represent location-based data. It takes your raw data – delivery locations, traffic patterns, vehicle positions, warehouse locations, and much more – and transforms it into clear, actionable insights. Instead of looking at spreadsheets of numbers, you're looking at a dynamic, visual representation of your entire operation. This simple yet profound shift changes how you make decisions.

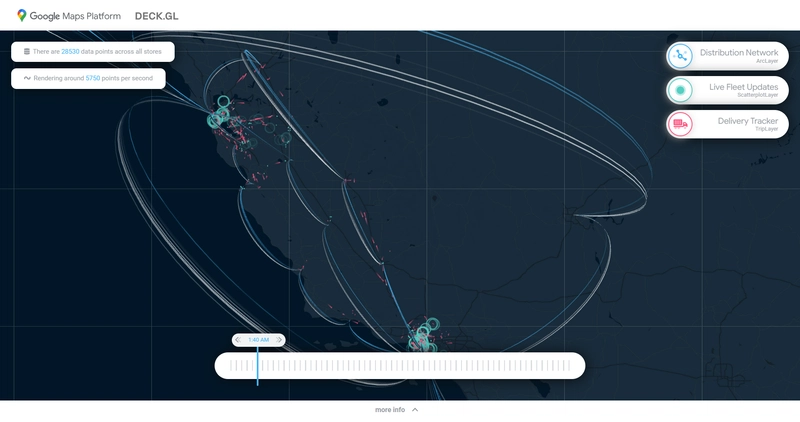
Geospatial data visualization using deck.gl by Google Maps
Let's see how geospatial visualization directly addresses the challenges we outlined:
2.1. Route Optimization:
Instead of relying on static routes or gut feeling, you integrate real-time traffic data, road closures, and even weather conditions into your route planning. Geospatial visualization software uses algorithms to dynamically optimize routes, minimizing travel time, fuel consumption, and driver stress. You're not just reacting to delays; you're actively avoiding them.
2.2. Real-time Visibility:
Forget outdated tracking methods. Geospatial mapping provides a clear picture of your assets' location and status at all times. This allows for proactive management of potential issues. Delays are identified quickly, allowing you to redirect resources, notify customers, and avoid costly disruptions.
2.3. Strategic Resource Allocation:
Geospatial visualization empowers data-driven decisions about resource allocation. By visualizing the density of deliveries in certain areas, driver workloads can be balanced more efficiently. You can see which warehouses are underutilized or strategically placed for optimizing distribution. You aren't just reacting to resource constraints; you are actively managing them.
This data-driven approach moves logistics management beyond reactive problem-solving and into proactive optimization. This transition sets the stage for the significant benefits we'll explore in the next section, allowing you to leverage location data to unlock improvements in efficiency, cost savings, and customer satisfaction.
III. Level Up Your Logistics: The Power of Geospatial Visualization
This technology empowers you to make data-driven decisions that lead to significant improvements in efficiency and customer satisfaction. Let's explore how:
3.1. Speed Up Deliveries:
Real-time tracking of vehicles and shipments gives you complete visibility into your supply chain. This allows you to monitor progress and proactively address any issues that arise. By doing so, you ensure timely deliveries, meeting—and often exceeding—customer expectations, leading to the next benefit.
3.2. Boosting Customer Satisfaction:
In today's competitive landscape, exceeding customer expectations is vital. By leveraging geospatial visualization to ensure timely and efficient deliveries, you directly contribute to improved customer satisfaction. This leads to increased loyalty, enhanced brand reputation, and ultimately, stronger business growth.
3.3. Improve Driver Efficiency:
Happy drivers equal efficient operations. By implementing real-time updates, you alleviate driver stress and reduce unproductive idle time. This results in higher productivity, increased job satisfaction, and a positive impact on employee retention.
3.4. Empowering a more strategic and holistic approach to logistics management:
By providing a comprehensive view of your entire operation, geospatial visualization allows you to identify interconnected inefficiencies and optimize your entire supply chain, not just individual components. This holistic perspective facilitates better decision-making, leading to improved resource allocation, risk mitigation, and ultimately, a more resilient and profitable logistics network.
IV. Beyond Logistics: The Broader Impact of Geospatial Data Visualization
I have focused on the powerful applications of geospatial data visualization in optimizing logistics. However, the benefits extend far beyond this sector. To explore the broader impact of this transformative technology across various industries and business functions, I recommend reading this comprehensive guide: From Data to Decisions: How Geospatial Data Visualization Impacts Your Business.
Conclusion
The logistics landscape is constantly evolving, and the businesses that thrive will be those that embrace innovation. Geospatial visualization is a key tool in this transformation, equipping companies to meet today's challenges and drive future growth. Start exploring the possibilities today!
Featured ones:
